Avengers: What do they talk about?
Matthew Winn
April 8, 2018

Turns out, the characters DO have distinctive patterns of using words.
The extent of each line represents the degree to which that character is more likely to use that word compared to other characters.
Notice how Cap talks about people (especially Tony). T’Challa (Black Panther)’s speech is marked by noble topics, opposite of Spiderman, who bumbles around like the teenager that he is. Hulk (Bruce Banner) and Clint (Hawkeye) both are notable for referring to Nat (Black Widow), although for different reasons. Vision and Scarlet Witch talk about very similar themes, which might explain why they seem to gravitate toward each other. Thor’s got his mind set on the bigger picture, leading directly into the events to come in Infinity War. Loki, Unsurprisingly, is the character most likely to talk about power. Ultron wants power in an entirely different way, and is more poetic.
All of these patterns were identified by Elle O’Brien, who uses neural networks to generate predictive text for Botnik Studios. The visualization project was initiated during a meetup of Data Viz Jam Sessions, hosted by Nancy Organ.
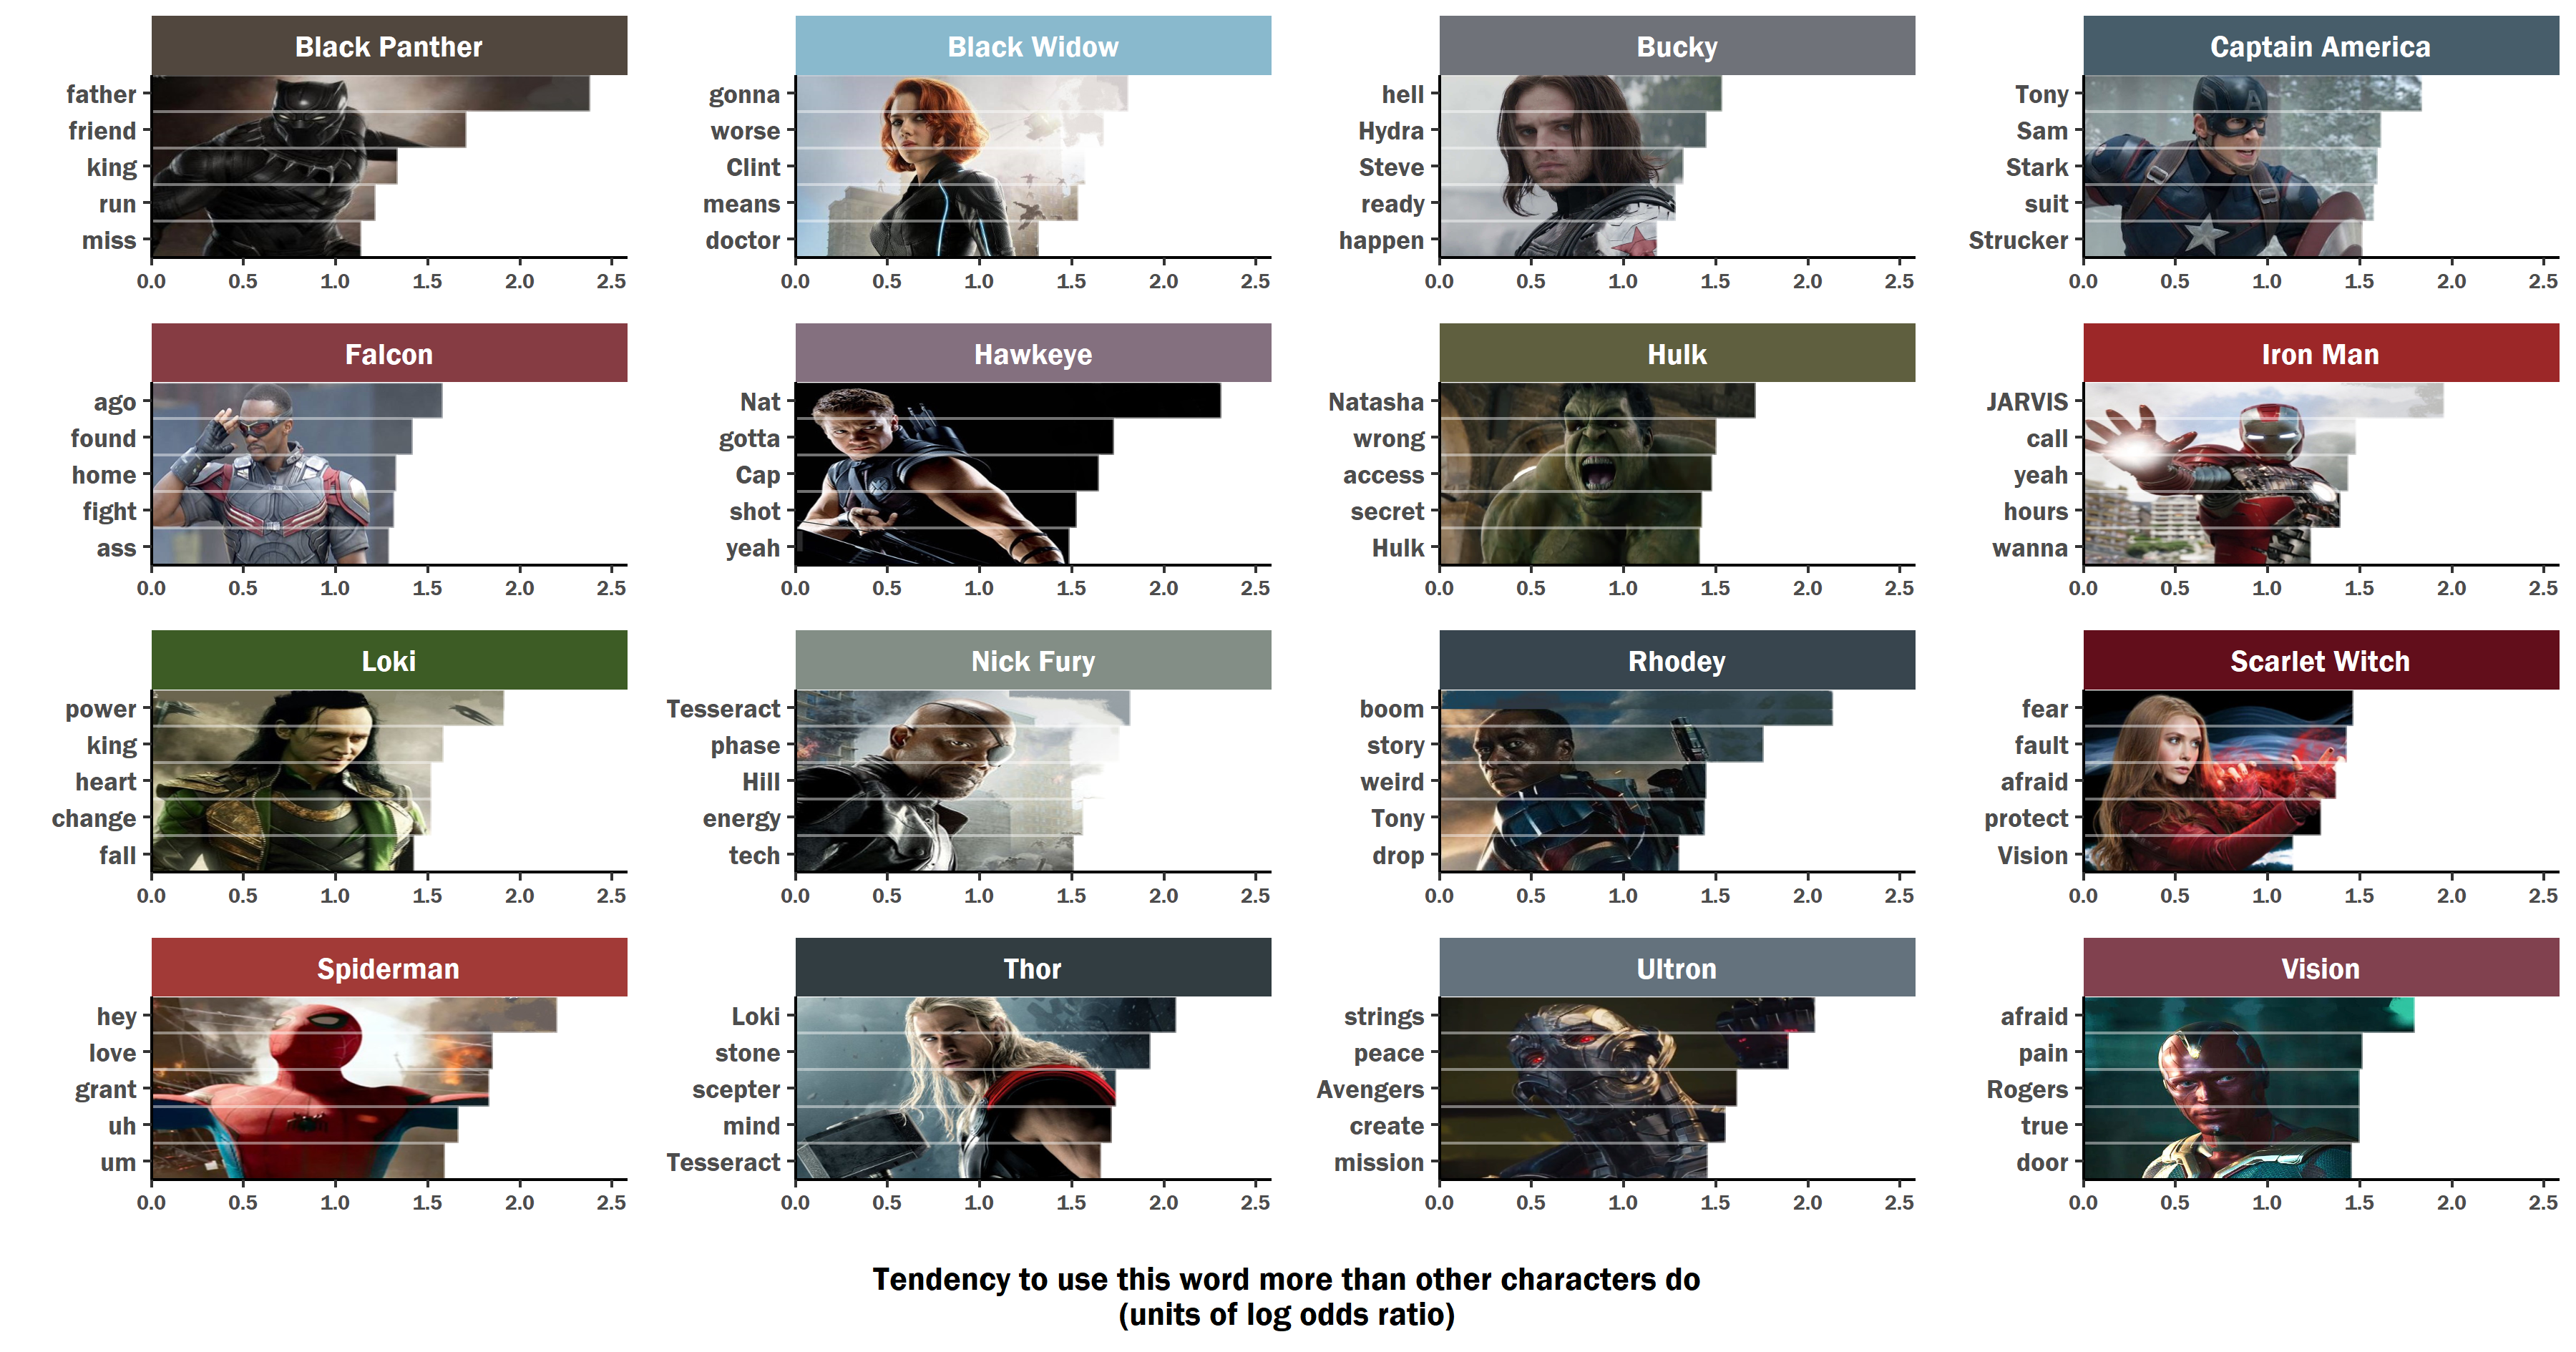
NOW this is an exercise in visualizing the data using R.
Want to find out how this plot was made? read on!
Here are the R packages that we will use:
library(dplyr)
library(grid)
library(gridExtra)
library(ggplot2)
library(reshape2)
library(cowplot)
library(jpeg)
library(extrafont)
Some people say that it’s bad form to use this “clear everything” line. I do it routinely at the top of a script to make sure that when I run it, it doesn’t depend on any objects that I accidentally left in the workspace.
rm(list = ls())This is the folder that contains all the images
dir_images <- "C:\\Users\\Matt\\Documents\\R\\Avengers"
setwd(dir_images)
Set font
windowsFonts(Franklin=windowsFont("Franklin Gothic Demi"))simple version of character names
character_names <- c("black_panther","black_widow","bucky","captain_america",
"falcon","hawkeye","hulk","iron_man",
"loki","nick_fury","rhodey","scarlet_witch",
"spiderman","thor","ultron","vision")
image_filenames <- paste0(character_names, ".jpg")Function to read in the image file corresponding to the simple character name
read_image <- function(filename){
char_name <- gsub(pattern = "\\.jpg$", "", filename)
img <- jpeg::readJPEG(filename)
return(img)
}Read all the images into one list
all_images <- lapply(image_filenames, read_image)Assign names to the list of images, so they can be indexed by character
names(all_images) <- character_namesHere’s an example of how easy it is, using those names
# clear the plot window
grid.newpage()
# draw to the plot window
grid.draw(rasterGrob(all_images[['vision']]))
Get the text data
This was collected by Elle O’Brien, using some fancy text mining analysis on the movie scripts.

I know that you won’t be able to download it on your own computer using this line (because you don’t have the file), but maybe Elle might share it. If she wants to share it here, I’ll update this page.
load("Avengers_word_data.RData")Correct the capitalization of proper names
capitalize <- Vectorize(function(string){
substr(string,1,1) <- toupper(substr(string,1,1))
return(string)
})
proper_noun_list <- c("clint","hydra","steve","tony",
"sam","stark","strucker","nat","natasha",
"hulk","tesseract", "vision",
"loki","avengers","rogers", "cap", "hill")
# Run the capitalization function
word_data <- word_data %>%
mutate(word = ifelse(word %in% proper_noun_list, capitalize(word), word)) %>%
mutate(word = ifelse(word == "jarvis", "JARVIS", word))Notice that the simplified character names from before don’t match the nicely formatted character names in the text dataframe
unique(word_data$Speaker)## [1] "Black Panther" "Black Widow" "Bucky"
## [4] "Captain America" "Falcon" "Hawkeye"
## [7] "Hulk" "Iron Man" "Loki"
## [10] "Nick Fury" "Rhodey" "Scarlet Witch"
## [13] "Spiderman" "Thor" "Ultron"
## [16] "Vision"Make a lookup table to convert shorthand file names to pretty character names
character_labeler <- c(`black_panther` = "Black Panther",
`black_widow` = "Black Widow",
`bucky` = "Bucky",
`captain_america` = "Captain America",
`falcon` = "Falcon", `hawkeye` = "Hawkeye",
`hulk` = "Hulk", `iron_man` = "Iron Man",
`loki` = "Loki", `nick_fury` = "Nick Fury",
`rhodey` = "Rhodey",`scarlet_witch` ="Scarlet Witch",
`spiderman`="Spiderman", `thor`="Thor",
`ultron` ="Ultron", `vision` ="Vision")Have two different versions of character names
one for display (pretty) and one for simple organization and referring to image file names (simple)
convert_pretty_to_simple <- Vectorize(function(pretty_name){
# pretty_name = "Vision"
simple_name <- names(character_labeler)[character_labeler==pretty_name]
# simple_name <- as.vector(simple_name)
return(simple_name)
})
# convert_pretty_to_simple(c("Vision","Thor"))
# just for fun, the inverse of that function
convert_simple_to_pretty <- function(simple_name){
# simple_name = "vision"
pretty_name <- character_labeler[simple_name] %>% as.vector()
return(pretty_name)
}
# example
convert_simple_to_pretty(c("vision","black_panther"))## [1] "Vision" "Black Panther"Add simplified character names to the text data frame
word_data$character <- convert_pretty_to_simple(word_data$Speaker)Assign a main color for each character
character_palette <- c(`black_panther` = "#51473E",
`black_widow` = "#89B9CD",
`bucky` = "#6F7279",
`captain_america` = "#475D6A",
`falcon` = "#863C43", `hawkeye` = "#84707F",
`hulk` = "#5F5F3F", `iron_man` = "#9C2728",
`loki` = "#3D5C25", `nick_fury` = "#838E86",
`rhodey` = "#38454E",`scarlet_witch` ="#620E1B",
`spiderman`="#A23A37", `thor`="#323D41",
`ultron` ="#64727D", `vision` ="#81414F" )Make a horizontal bar plot
avengers_bar_plot <- word_data %>%
group_by(Speaker) %>%
top_n(5, amount) %>%
ungroup() %>%
mutate(word = reorder(word, amount)) %>%
ggplot(aes(x = word, y = amount, fill = character))+
geom_bar(stat = "identity", show.legend = FALSE)+
scale_fill_manual(values = character_palette)+
scale_y_continuous(name ="Log Odds of Word",
breaks = c(0,1,2)) +
theme(text = element_text(family = "Franklin"),
# axis.title.x = element_text(size = rel(1.5)),
panel.grid = element_line(colour = NULL),
panel.grid.major.y = element_blank(),
panel.grid.minor = element_blank(),
panel.background = element_rect(fill = "white",
colour = "white"))+
# theme(strip.text.x = element_text(size = rel(1.5)))+
xlab("")+
coord_flip()+
facet_wrap(~Speaker, scales = "free_y")
avengers_bar_plot
This is pretty good.
But I want to plot something more ambitious. We want the character images to show through the bars.
The idea is to display the image only in the area of the bar, cutting it off at the bar endpoint.
To do this, we will display a transparent bar, and then at the bar endpoint, plot a white bar extending to the plot edge, to cover up the rest of the picture


In the data, frame, we now want to complement the numeric values with remainder of value needed to reach the overall max (plus a bit more), so that when combining value with remainder, everything adds to the same maximum number, forming a combination of lines with uniform length.
max_amount <- max(word_data$amount)
word_data$remainder <- (max_amount - word_data$amount) + 0.2Extract only top 5 words for each character
word_data_top5 <- word_data %>%
group_by(character) %>%
arrange(desc(amount)) %>%
slice(1:5) %>%
ungroup()Convert amount & remainder to long format

This ensures that there are two entries for each character-word pair; one for the real amount (“amount”), and one for picking up where that ends, extending out to a common max value (“remainder”).
This will collapse the “amount” and “remainder” into a single column called “variable”, indicating which value it is, and another column “value” containing the number from each of those values.
word_data_top5_m <- melt(word_data_top5, measure.vars = c("amount","remainder"))variable is the marker of whether the value is the real amount, or the compensated amount.
Now we put those levels in an ordered factor, reversed from how it was determined in the melt function. Otherwise, the “amount” and “remainder” will show up in reverse order on the plot.
word_data_top5_m$variable2 <- factor(word_data_top5_m$variable,
levels = rev(levels(word_data_top5_m$variable)))Function to display top-5 word data for a single character
The only argument is character, declared in simple form (“black_panther” instead of “Black Panther”)
plot_char <- function(character_name){
# example: character_name = "black_panther"
# plot details that we might want to fiddle with
# thickness of lines between bars
bar_outline_size <- 0.5
# transparency of lines between bars
bar_outline_alpha <- 0.25
#
# The function takes the simple character name,
# but here, we convert it to the pretty name,
# because we'll want to use that on the plot.
pretty_character_name <- convert_simple_to_pretty(character_name)
# Get the image for this character,
# from the list of all images.
temp_image <- all_images[character_name]
# Make a data frame for only this character
temp_data <- word_data_top5_m %>%
dplyr::filter(character == character_name) %>%
mutate(character = character_name)
# order the words by frequency
# First, make an ordered vector of the most common words
# for this character
ordered_words <- temp_data %>%
mutate(word = as.character(word)) %>%
dplyr::filter(variable == "amount") %>%
arrange(value) %>%
`[[`(., "word")
# order the words in a factor,
# so that they plot in this order,
# rather than alphabetical order
temp_data$word = factor(temp_data$word, levels = ordered_words)
# Get the max value,
# so that the image scales out to the end of the longest bar
max_value <- max(temp_data$value)
fill_colors <- c(`remainder` = "white", `value` = "white")
# Make a grid object out of the character's image
character_image <- rasterGrob(all_images[[character_name]],
width = unit(1,"npc"),
height = unit(1,"npc"))
# make the plot for this character
output_plot <- ggplot(temp_data)+
aes(x = word, y = value, fill = variable2)+
# add image
# draw it completely bottom to top (x),
# and completely from left to the the maximum log-odds value (y)
# note that x and y are flipped here,
# in prep for the coord_flip()
annotation_custom(character_image,
xmin = -Inf, xmax = Inf, ymin = 0, ymax = max_value) +
geom_bar(stat = "identity", color = alpha("white", bar_outline_alpha),
size = bar_outline_size, width = 1)+
scale_fill_manual(values = fill_colors)+
theme_classic()+
coord_flip(expand = FALSE)+
# use a facet strip,
# to serve as a title, but with color
facet_grid(. ~ character, labeller = labeller(character = character_labeler))+
# figure out color swatch for the facet strip fill
# using character name to index the color palette
# color= NA means there's no outline color.
theme(strip.background = element_rect(fill = character_palette[character_name],
color = NA))+
# other theme elements
theme(strip.text.x = element_text(size = rel(1.15), color = "white"),
text = element_text(family = "Franklin"),
legend.position = "none",
panel.grid = element_blank(),
axis.text.x = element_text(size = rel(0.8)))+
# omit the axis title for the individual plot,
# because we'll have one for the entire ensemble
theme(axis.title = element_blank())
return(output_plot)
}X axis title to be used for the main plot of all characters
plot_x_axis_text <- paste("Tendency to use this word more than other characters do",
"(units of log odds ratio)", sep = "\n")Show how this function would work for one character
sample_plot <- plot_char("black_panther")+
theme(axis.title = element_text())+
# x lab is still declared as y lab
# because of coord_flip()
ylab(plot_x_axis_text)
sample_plot
Why are we using that peculiar horizontal axis with “log odds ratio”?
Because as the numbers get higher, the odds get really high (we won’t get into the math here); transforming them to a log scale constrains the amount of variability that you need to display on the screen.
In case you want to convert these log odds to a simple probability, here is a function:
logit2prob <- function(logit){
odds <- exp(logit)
prob <- odds / (1 + odds)
return(prob)
}… and so here’s what that axis would look like:
logit2prob(seq(0, 2.5, 0.5))## [1] 0.5000000 0.6224593 0.7310586 0.8175745 0.8807971 0.9241418Notice the diminishing difference between consecutive items in that sequence:
diff(logit2prob(seq(0, 2.5, 0.5)))## [1] 0.12245933 0.10859925 0.08651590 0.06322260 0.04334474Okay, now that we’ve made that one plot…
and explored some details of it,
Let’s apply that function to list of all characters, putting all the plots into one list object.
all_plots <- lapply(character_names, plot_char)
### Function to extract the axis title from the plot
not just the text, but the actual thing drawn.
You can choose which axis (x/y) you want to extract
get_axis_grob <- function(plot_to_pick, which_axis){
# plot_to_pick <- sample_plot
tmp <- ggplot_gtable(ggplot_build(plot_to_pick))
# tmp$grobs
# find the grob that looks like
# it would be the x axis
axis_x_index <- which(sapply(tmp$grobs, function(x){
# for all the grobs,
# return the index of the one
# where you can find the text
# "axis.title.x" or "axis.title.y"
# based on input argument `which_axis`
grepl(paste0("axis.title.",which_axis), x)}
))
axis_grob <- tmp$grobs[[axis_x_index]]
return(axis_grob)
} Extract axis title grobs
px_axis_x <- get_axis_grob(sample_plot, "x")
px_axis_y <- get_axis_grob(sample_plot, "y") Here’s how you’d use those extracted axes:
grid.newpage()
grid.draw(px_axis_x) 
# grid.draw(px_axis_y) Arrange all those plots into one object
big_plot <- arrangeGrob(grobs = all_plots)Take that big ensemble of plots, and insert the x axis underneath, since each plot doesn’t have an x axis, and we want a single axis for all of them.
Note that the big plot is 10x as tall as the axis.
big_plot_w_x_axis_title <- arrangeGrob(big_plot,
px_axis_x,
heights = c(10,1))
grid.newpage()
grid.draw(big_plot_w_x_axis_title)
Oh no! those plots all take up slightly different amount of page space because the words have different lengths.
It looks a little messy.
Normally, we ensure neat and aligned arrangement of plots using facet_grid() or facet_wrap(), but we can’t use those here, because each plot gets its own custom background image that can’t be mapped to a facet as would other columns in a data frame (because the image isn’t actually part of the data frame).
Use cowplot instead of arrangeGrob,
so that plot axes are aligned vertically
big_plot_aligned <- cowplot::plot_grid(plotlist = all_plots, align = 'v', nrow = 4)Add the X axis title under the aligned grid of plots, just like before
big_plot_w_x_axis_title_aligned <- arrangeGrob(big_plot_aligned,
px_axis_x,
heights = c(10,1))Here’s how to draw that ensemble plot to the screen:
grid.newpage()
grid.draw(big_plot_w_x_axis_title_aligned)
Nice :)
Save the final plot.
ggsave(big_plot_w_x_axis_title_aligned,
file = "Avengers_Word_Usage.png",
width = 12, height = 6.3)Click here if you want to download a better-quality version than the one embedded here!
The end!
Who am I?
Matt Winn
I’m a hearing scientist/audiologist who works at the Univ of Washington (soon: the Univ of Minnesota). Nope, that has nothing to do with the Avengers, but if you help to understand challenges and solutions for human communication, you’re a hero to me ;)
